Unlocking Data Locally: An End-to-End On-Premises Data Stack
The current story of data infrastructure often reads like an uncritical love letter to the cloud. Industry narratives celebrate AWS's vast service catalog, Google Cloud's AI scalability, Azure's legacy migration capabilities, and the disruptive potential of cloud-native warehouses like Snowflake and Databricks.
It's easy to get the impression that building locally, on your own servers, is a solved problem from a bygone era. But is that the whole story? As someone navigating the data landscape, particularly in data-conscious Germany, I found myself asking: where does the self-hosted stack fit in this "modern" picture? Far from being obsolete, running your own data infrastructure offers compelling advantages in control, cost, and customization.
This isn't about reverting to outdated methods; it's about strategically leveraging powerful tools and architectural patterns within your own environment. To make this concrete, I'll share insights from a fully functional, modern data stack built and running right here on my local server. We will examine why this approach is not just feasible but offers significant advantages, proving that self-hosting remains a highly relevant and potent strategy in today's data landscape.
The Goal - What Insights Are We Chasing?
We've established why exploring a self-hosted data stack is a worthwhile endeavor. To truly appreciate how the components of our locally run infrastructure work together, we need a tangible project – a specific goal driving our data pipeline.
For this demonstration, we'll dive into the world of cryptocurrency markets. Our data source will be the publicly accessible API provided by Binance, one of the leading global cryptocurrency exchanges. This API offers real-time and historical market data, making it an excellent candidate for showcasing a data ingestion and processing workflow.
Our specific focus will be on acquiring kline data. For those unfamiliar, klines (or candlestick charts) are a fundamental tool in financial analysis, providing a visual summary of price movements (open, high, low, close) and trading volume for an asset over specific time intervals (e.g., every minute, hour, or day). You can preview the dashboard we'll build at klines.bi-solutions-hamburg.com, which I'll also embed in the analytics chapter of this article.
The primary objective of this exercise is therefore:
Ingest: Reliably pull historical and potentially ongoing kline data for various cryptocurrency pairs from the Binance API.
Store: Persist this data efficiently and effectively within a self-hosted data lakehouse architecture.
Visualize: Develop a dashboard that allows us to easily view the historical kline charts for selected cryptocurrencies.
What insights are we chasing initially? The goal isn't necessarily to perform complex financial modeling (though the stack could support that later), but rather to achieve clear visibility into market trends. We aim to build a dashboard where a user can select a coin pair and see its price history visualized as a familiar candlestick chart.
While analyzing crypto trends is interesting, the core purpose of this use case within this article is to serve as a practical thread. It will allow us to illustrate how each part of our self-hosted stack – from data ingestion tools, through storage layers like MinIO and table formats like Iceberg, processing engines like Spark, query engines like Trino or ClickHouse, orchestration with Dagster, and finally visualization via Streamlit – plays its role in delivering a concrete outcome, all running within our controlled environment. This crypto data pipeline will be our proving ground.
Architecture
Overview - The Big Picture
First, let's start with a general overview of the different steps and technologies that are used in the local data stack to achieve our goal of analyzing Binance crypto data. The diagram below illustrates the journey our data will take.
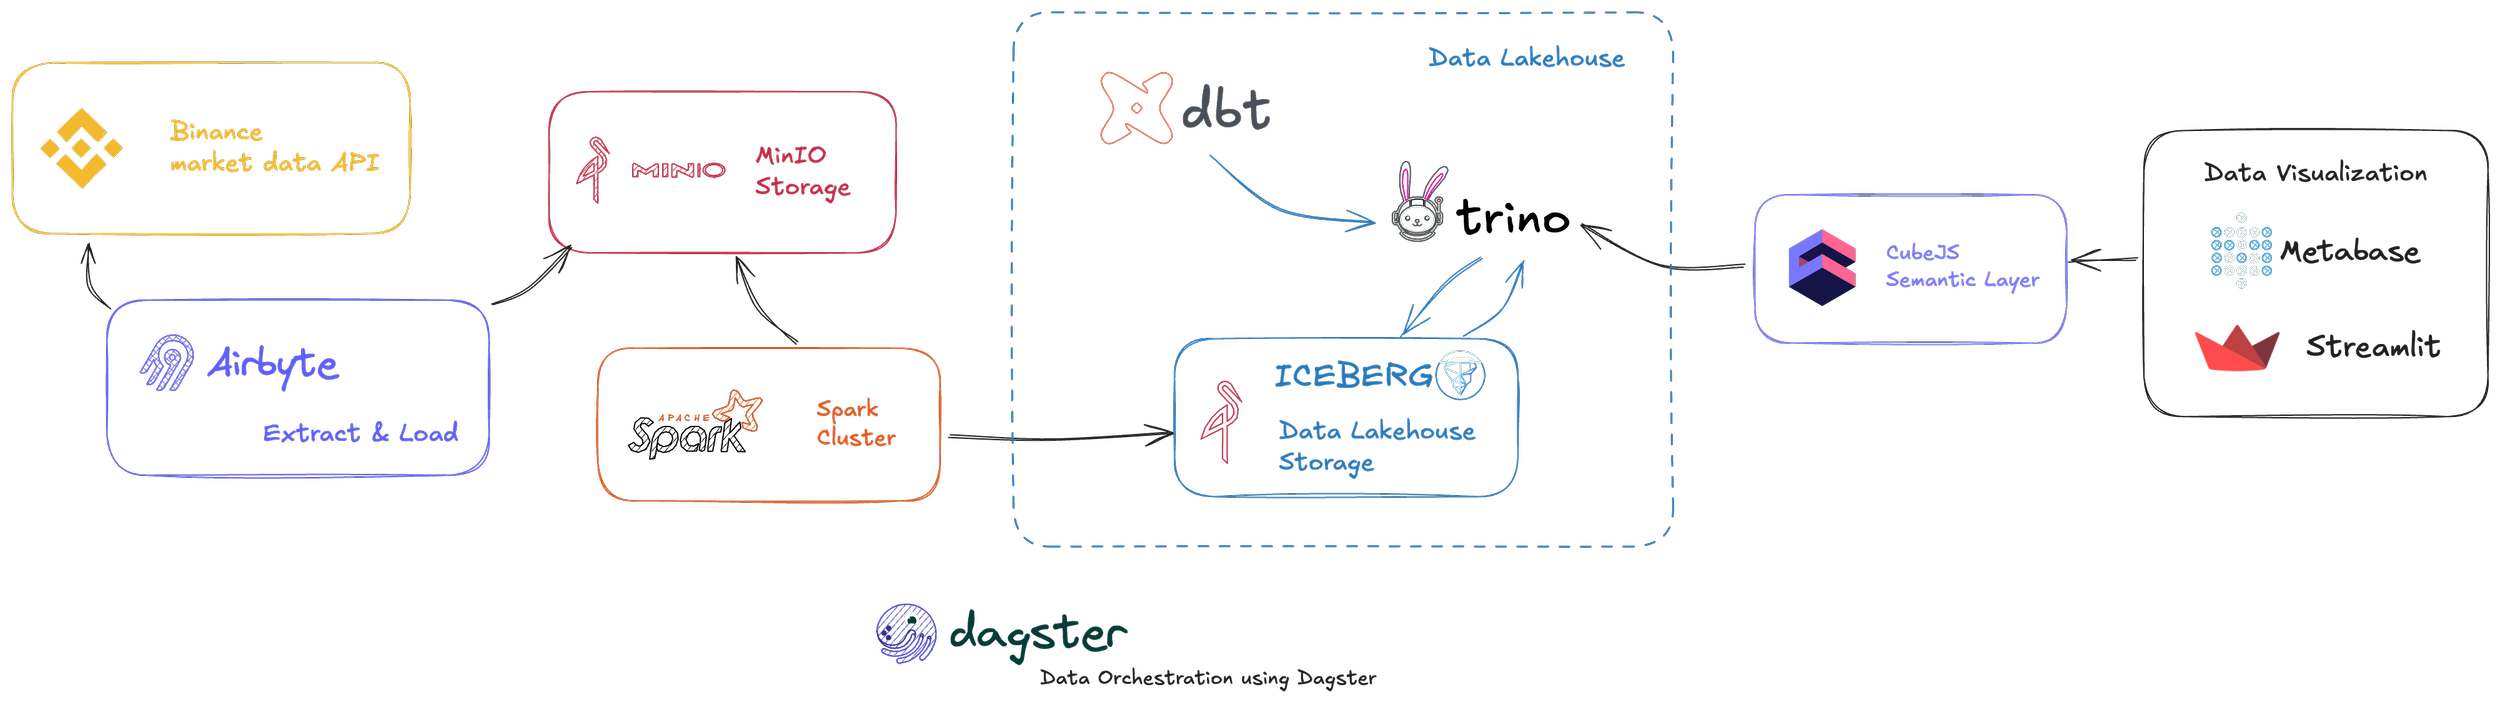
Our process begins with data extraction. In the first step, we are extracting data from the already mentioned Binance Rest API using Airbyte. Airbyte is a powerful open-source data integration engine specifically designed to help move data from a wide variety of sources into your database, data lake, or data warehouse.
In our case, Airbyte moves the extracted crypto data into a data lake that is set up using MinIO. MinIO serves as our object storage solution, built specifically for high-performance, on-premise use cases. It provides an S3-compatible interface, making it a flexible foundation for our raw data.
In the next step, we are loading the data from this MinIO-based data lake into a data lakehouse. This transformation is handled by a self-hosted Apache Spark cluster. Spark processes the raw data and structures it using the Apache Iceberg open table format. Iceberg brings crucial features like ACID transactions, schema evolution, and time travel capabilities to our data residing in object storage, effectively creating the lakehouse.
With the data structured in Iceberg tables, we need an efficient way to query it. For this, we use Trino (formerly PrestoSQL). Trino acts as a distributed SQL query engine, allowing us to run fast analytical queries directly on top of our Iceberg tables within the lakehouse.
Data rarely arrives perfectly ready for analysis. Within the data lakehouse, data has to be transformed into a structured data model optimized for analytics. To manage this critical step, we are using dbt. dbt enables us to define, document, test, and run our data transformations using SQL, bringing software engineering best practices to our analytics code.
On top of the transformed data in the data lakehouse, we are going to set up a semantic layer. This layer helps us define business logic and metrics centrally, ensuring cleaner and more consistent analytics downstream. The technology we are using here is Cube (formerly Cube.js).
Lastly, we come to the analytics part, where we set up dashboards to visualize our data. In this example, I am utilizing Streamlit. Streamlit is a fantastic Python framework that lets you create and share clean, interactive web applications and dashboards with relative ease, perfect for displaying our kline charts.
Coordinating this entire sequence of tasks – from Airbyte's ingestion schedule to dbt transformations and potential updates – is Dagster. Dagster serves as our open-source data orchestration tool, allowing us to define our workflows as Python code, manage dependencies between steps, monitor runs, and schedule executions reliably.
It's worth acknowledging that this architectural approach, incorporating distinct tools for ingestion, storage, processing, transformation, querying, semantics, orchestration, and visualization, might feel a little excessive for the simple use case we are chasing (visualizing crypto klines). But the goal for this demo is precisely that: to provide you with a full, concrete example of how a potentially large-scale, feature-rich data stack, composed of modern components, can be effectively implemented and run entirely locally on self-managed infrastructure.
Extract - Bringing the Data In
In this part, we will dive into the Extract stage of our data stack. Here we are extracting data from the Binance market data REST API and loading it to our MinIO data storage, which acts as our initial data lake, the landing zone for raw information.

Binance REST API
First off, let's have a look at the source: the Binance Market Data API. From here, we are extracting the crypto kline (candlestick) data per coin.
The API conveniently provides this data in a standard JSON format.

For our specific use case, we've decided to extract data on an hourly aggregation basis. The extraction process itself runs once per day, designed to fetch all the hourly kline records for the previous calendar day (from midnight to midnight UTC). This run iterates through a predefined list of cryptocurrency pairs relevant to our analysis.
The raw JSON data structure we receive from the API for each hourly interval looks like this:
Airbyte
To orchestrate the actual data movement – fetching data from the Binance API and loading it into our MinIO data lake – we are utilizing Airbyte. Airbyte is an open-source platform specializing in Extract and Load operations, offering a wide range of connectors.
After setting up Airbyte, we have to configure the Source connector in Airbyte. As of this writing, there isn't a dedicated, pre-built Binance connector available directly in Airbyte's catalog that fits our exact needs. However, Airbyte provides a powerful feature called the Connector Builder. Using this UI-driven tool, we can define how Airbyte should interact with the Binance REST API endpoint. Since the market data endpoint we're using is public and doesn't require authentication, configuring the API call within the builder is very straightforward.
Once the custom source connector is defined and tested, we configure the Destination. For writing to our MinIO storage, we can use Airbyte's pre-built S3 connector, as MinIO is S3-compatible. The setup process is well-documented here: https://docs.airbyte.com/integrations/destinations/s3. During configuration, you will provide the MinIO server endpoint, bucket name, and the access key/secret pair you created earlier. A key choice here is the output file format; selecting Parquet is highly recommended for data lake storage due to its columnar nature, compression efficiency, and performance benefits for downstream analytical queries.
Load - Landing in the Data Lakehouse
Next, we are going to load the data, currently residing as Parquet files in our MinIO data lake, into our data lakehouse for further processing and analytics. The core idea is to transition the data from its raw form into a structured, queryable format using robust table standards. To do this, we are going to set up a Spark cluster with a job that takes the raw Parquet data, creates or updates Apache Iceberg tables, and loads the data into them, typically in an incremental fashion. To keep track of the table structure and the snapshot versions crucial to Iceberg, we are also going to set up a REST catalog.
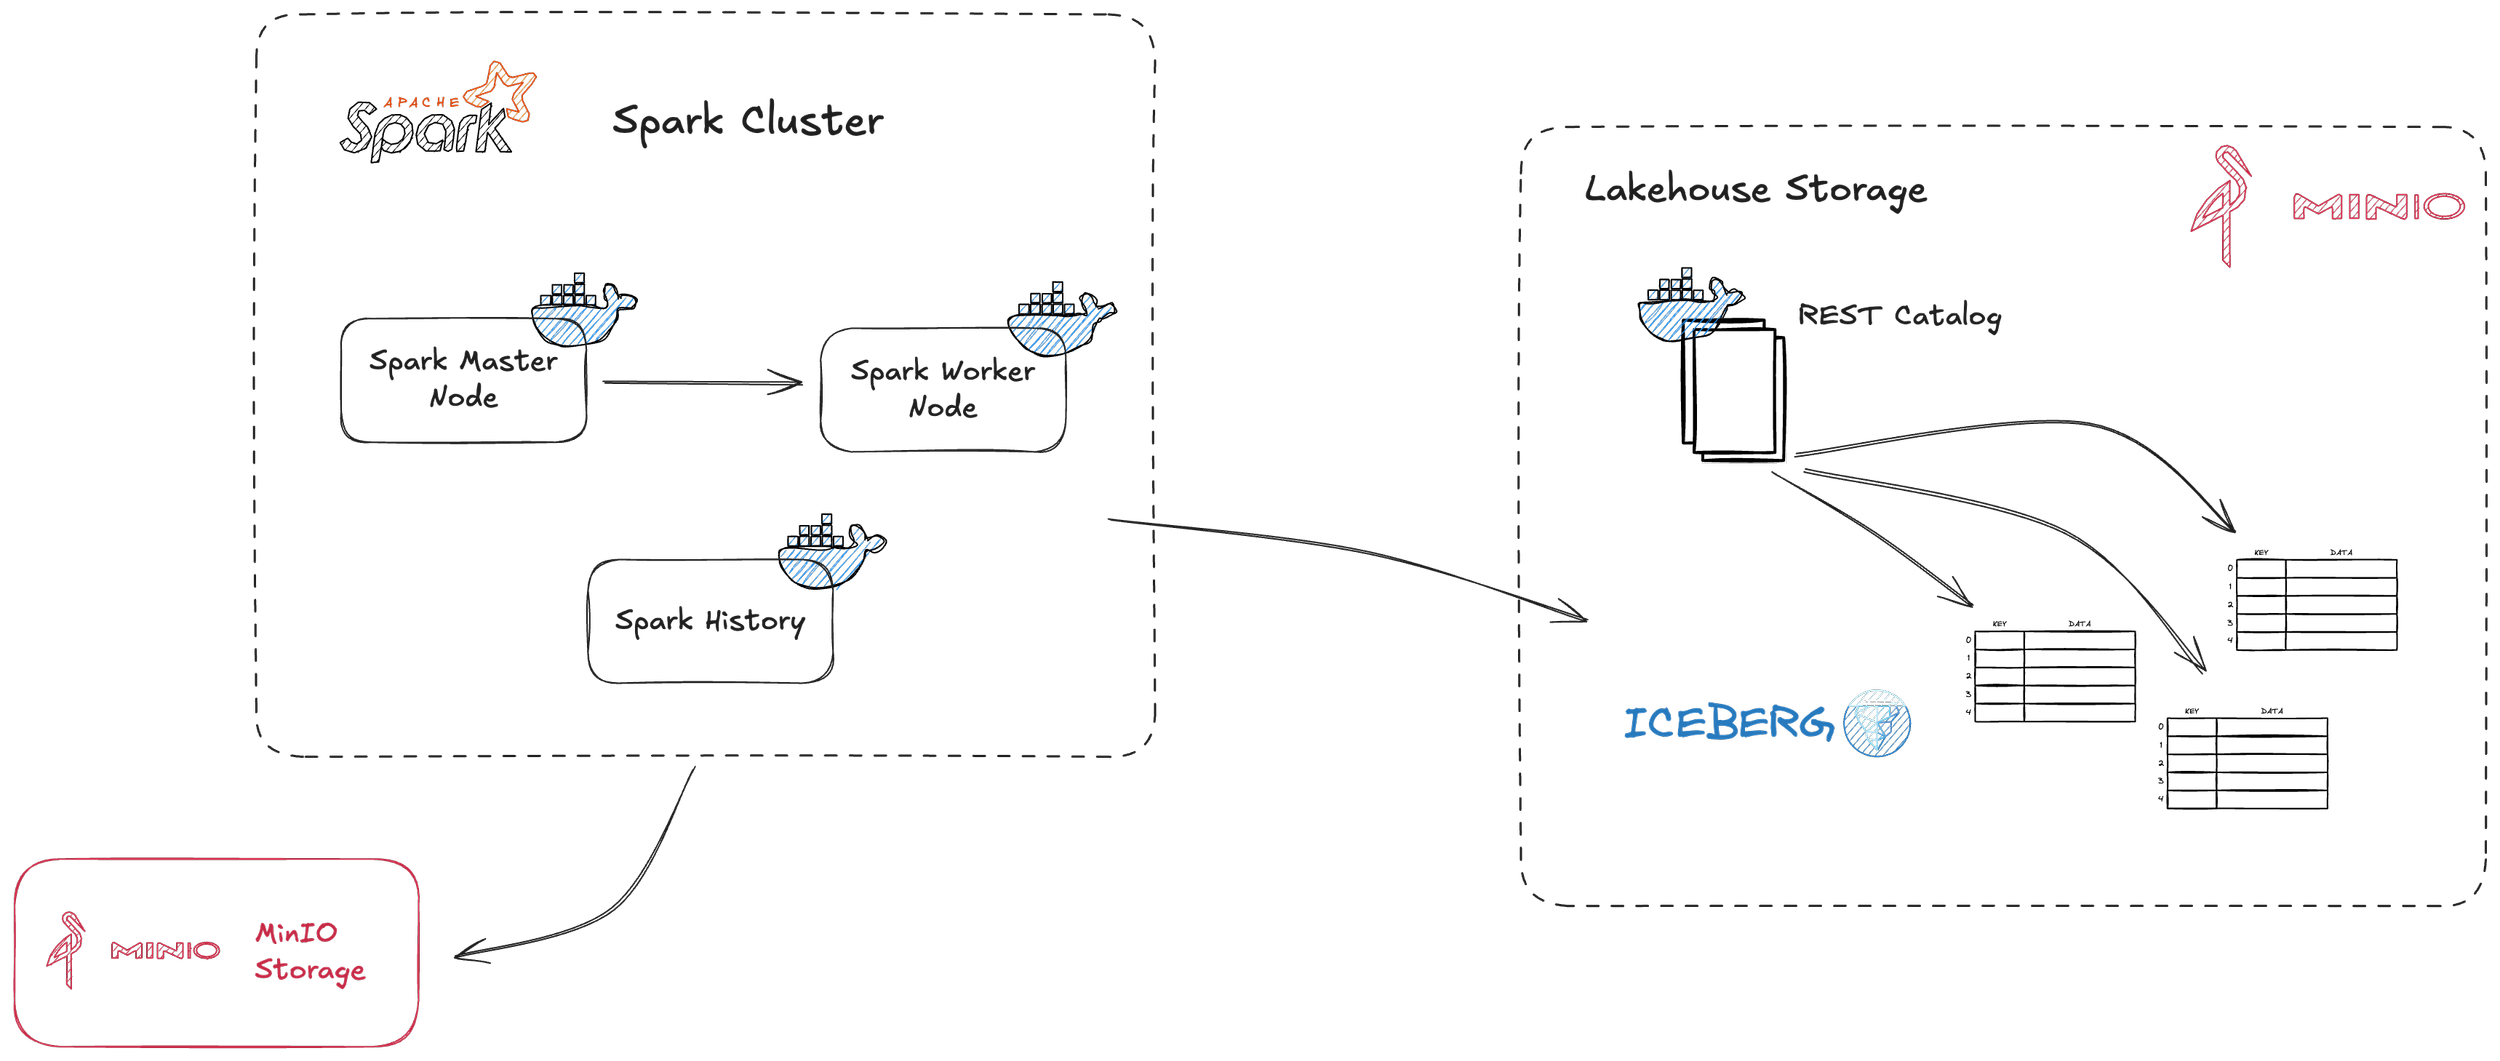
The engine driving this loading process is Apache Spark. Our self-hosted Spark cluster, managed via Docker, logically consists of three different parts:
Master Node: This container acts as the coordinator, managing the cluster resources and distributing Spark application tasks.
Worker Node(s): These containers are the workhorses that actually execute the computations and tasks assigned by the master.
Spark History Server: A helpful utility service that archives event logs from Spark applications and provides a web UI to review execution details, logs, and performance metrics after jobs complete.
For simplicity and efficiency, especially since I am running this entire stack on a single physical machine for this demonstration, I currently deploy only one worker node. However, a key advantage of this architecture is its scalability. If you encounter bigger workloads or need to run many jobs in parallel, you can easily scale the processing power up by configuring and deploying multiple worker nodes.
The Spark cluster components are defined as services within a Docker Compose stack, making deployment and management straightforward. You can find the exact configuration for the Spark cluster (along with other services we will explore in this and later chapters) in the docker-compose.yml file within the project repository here: https://github.com/svengonschorek/lakehouse-homeserver/blob/master/docker-compose.yml.
Loading Data into the Lakehouse
In the same repository, you will find an extract_load.py script. This script encapsulates the Spark job logic used to read the Parquet data from our MinIO object storage landing zone and load it into the lakehouse structure.
Our lakehouse utilizes Apache Iceberg as its open table format. Iceberg is crucial because it brings database-like reliability and features (ACID transactions, schema evolution, hidden partitioning, time travel) to data stored in object storage like MinIO. To manage the metadata associated with these Iceberg tables (schemas, partition specs, data file locations, snapshot history), we use an Iceberg REST catalog. This catalog service acts as a central point of truth for table information. In this implementation, the metadata for the REST catalog itself is persisted in a Postgres database.
The extract_load.py Spark job is designed primarily to load the kline data incrementally. Following our daily extraction pattern, this job typically targets only the Parquet files corresponding to the latest day's data in MinIO and efficiently merges or appends this new data into the Iceberg table in the landing zone of the data lakehouse.
It is also possible to perform full loads (complete overwrites) with the same script, which might be necessary during initial setup or for reprocessing specific periods. However, it's important to understand how Iceberg handles updates and overwrites. Each modification creates a new table snapshot, and the old version's data files might become "orphaned" (no longer referenced by an active snapshot). Frequent full loads can thus lead to an accumulation of unused files in your object storage.
Therefore, setting up garbage collection is important for maintaining storage efficiency. In our case, we handle this within the extract_load.py script by leveraging Iceberg's built-in maintenance functions. Specifically, we include a step that calls procedures like system.expire_snapshots(), which intelligently identifies and removes the metadata and associated data files for snapshots older than a configured retention period.
The full repository containing the Spark loading script, the Docker setup, and other configurations can be explored here: https://github.com/svengonschorek/lakehouse-homeserver/tree/master.
Transform - Building Data Models with dbt
Now we have the raw kline data available in our data lakehouse, residing in Apache Iceberg tables. While accessible, this raw data is often not in the ideal shape for direct querying, reporting, or business intelligence. In this next step, we need to transform this data into a desired format that is clean, well-structured, and optimized for analytics. To manage and execute these transformations, we are utilizing dbt (data build tool).
dbt is a powerful open-source command-line tool that helps us manage all data transformations using SQL. It applies software engineering best practices like version control, modularity, testing, and documentation directly to our analytics code, making the transformation process more robust and maintainable.
Data Modeling: The Blueprint for Analytics
Before we actually start writing transformation logic, we need to think about data modeling. Bringing data into a well-defined data model is crucial. It allows us to assure data quality, enforce consistency, and shape the data into a structure that is optimized for efficient data analytics and easy understanding by end-users.
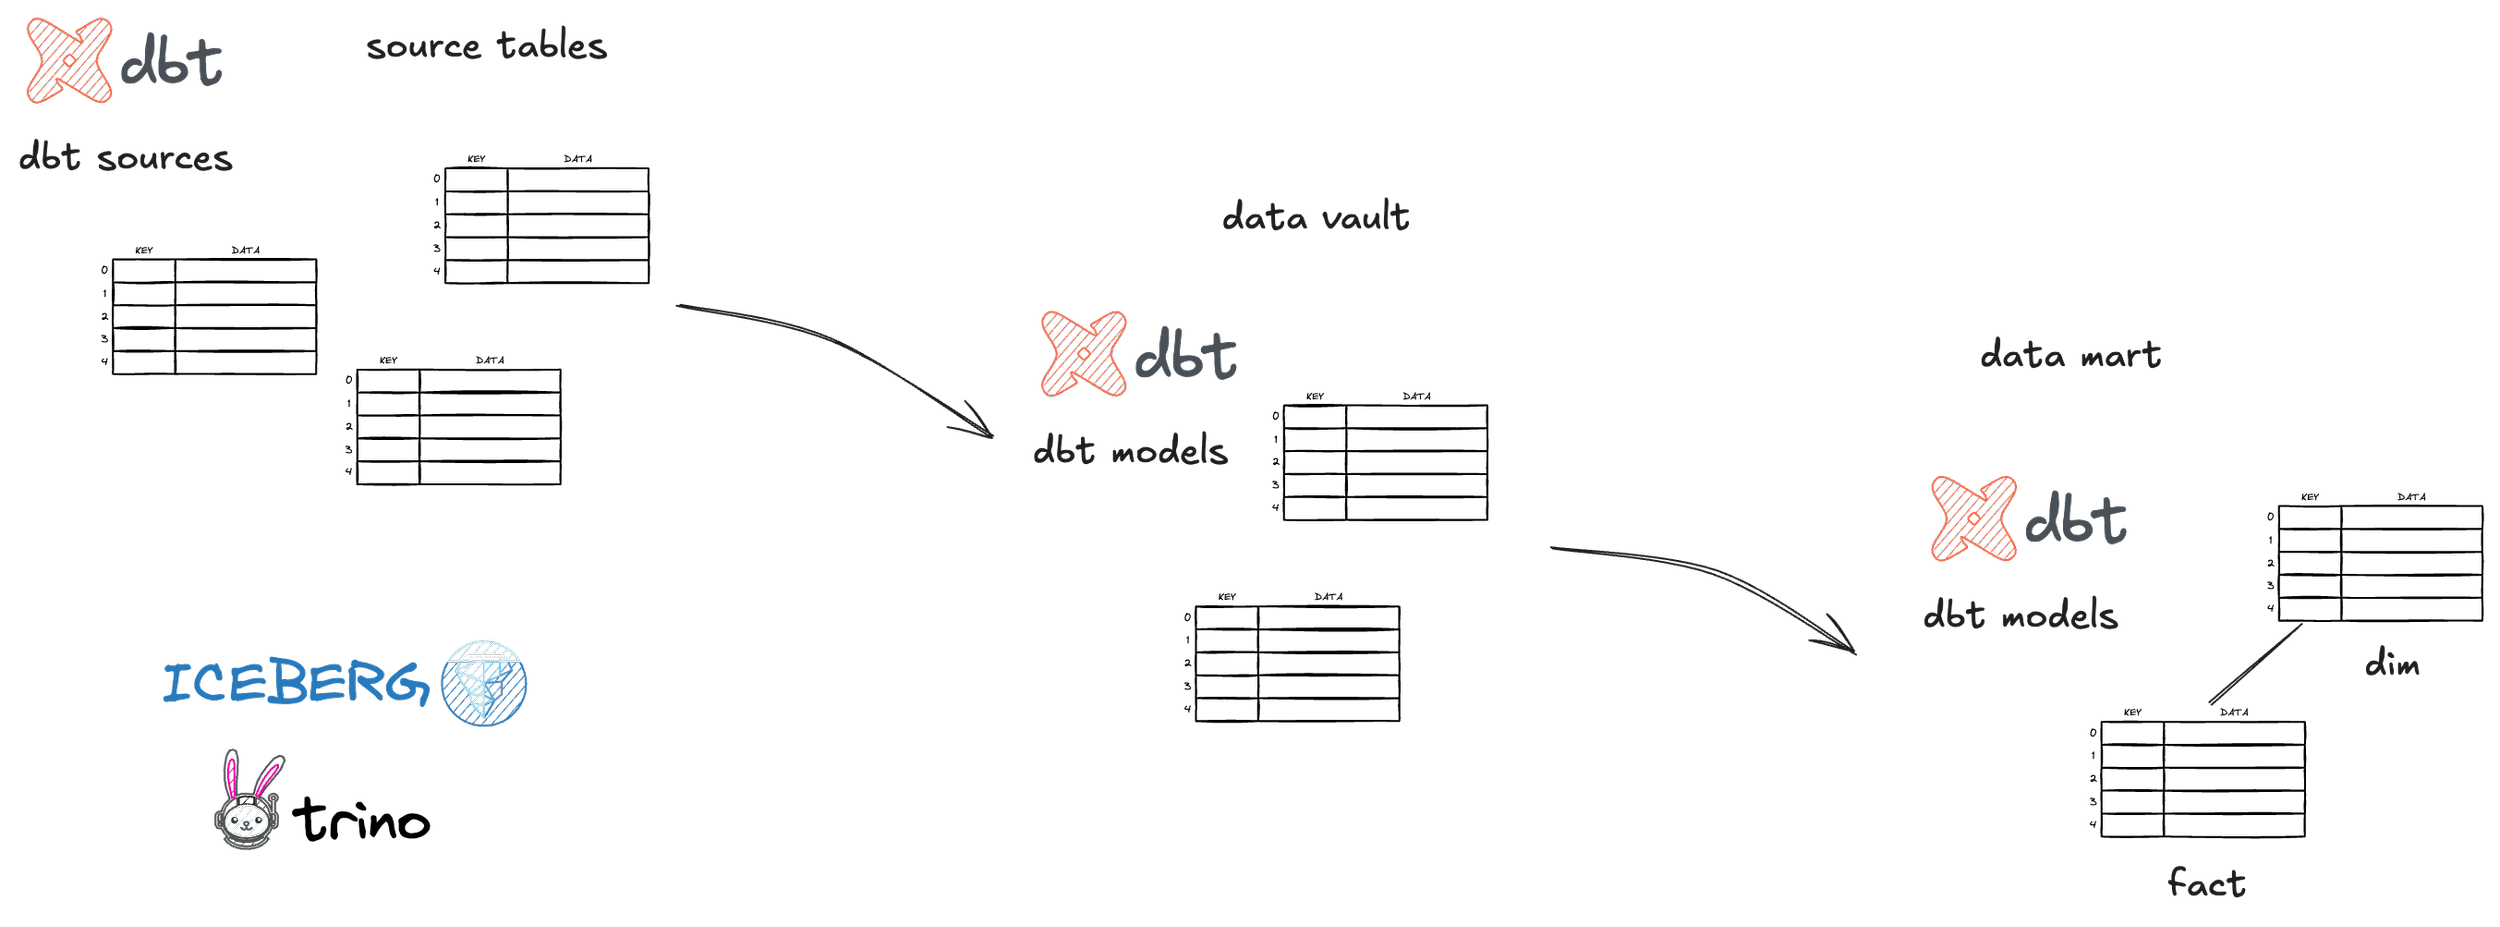
For our example, we are using a layered data modeling approach: starting with a Data Vault model, which then feeds a downstream Data Mart.
In the Raw Vault layer, we aim to integrate data from our source (the kline tables) while preserving its granularity and historical context. This layer is typically built using three core components:
Hubs: These define core business entities or concepts and are identified by a unique business key.
Links: These tables specify relationships between two or more Hubs.
Satellites: These hold the descriptive properties or attributes of a Hub or a Link, including how those attributes change over time.
This Data Vault approach provides a structured format with clear business keys that helps maintain a consistent and flexible data model as your project grows. This structure is great for storing all your data in an auditable and integrated way. However, it is not yet optimal for direct analytics because it is highly normalized and would require a lot of JOIN operations in our analytics queries to reconstruct meaningful views.
Therefore, we introduce a Data Mart layer that is fed by the Data Vault layer. Here, we provide classical fact and dimension tables. These tables are more denormalized and specifically designed for analytical querying. For example, we might create a FACT_HOURLY_KLINES table with foreign keys to dimensions like DIM_COIN and DIM_DATE, making it much easier to slice and dice the data. These fact and dimension tables can then be used effectively for analytics and to feed the semantic layer, which we will tackle in a later chapter.
Setting up dbt
In the first step to implement these transformations, we need to set up our dbt project. As query engine that dbt will use to interact with our Iceberg tables, we are using Trino. Trino, as previously mentioned, is an open-source distributed SQL query engine that lets you query data from various sources, including our data lakehouse.
To initially set up the dbt project for use with Trino, you first need to install the dbt-trino adapter in your Python environment. You can typically do that using PyPI with the command:
pip install dbt-trino
Afterwards, you can initialize a new dbt project by running the “dbt init <your_project_name>” command in your terminal. This command will set up the initial project structure with directories for models, tests, seeds, macros, etc.
We can use this dbt project now to:
Define our sources (pointing to the raw kline data we ingested into Iceberg tables using Spark).
Build models (the SQL
SELECTstatements that create our Hubs, Links, Satellites, and eventually our fact and dimension tables).Define data quality tests (e.g., checking for uniqueness, non-null values, or accepted values) to ensure the integrity of our transformed data.
In this article, I will not dive deeper into a comprehensive tutorial on how to use dbt's many features. To learn more, please check out the excellent official dbt documentation (https://docs.getdbt.com/docs/introduction). For a practical look at how dbt is used with Trino to implement the Data Vault and Data Mart models for this specific crypto data example, you can refer to the dbt project in this repository: https://github.com/svengonschorek/dbt-trino-homeserver.
Orchestrate - Making it Flow with Dagster
So far, we have learned that we extract data with Airbyte, and afterwards, we use Spark to load the data into the data lakehouse. Following that, we transform the data utilizing dbt. But how are these distinct tools connected, and how are their different jobs and processes executed in the correct sequence and at the appropriate times? This is where data orchestration comes into play.
With data orchestration, we are able to define the entire data workflow, manage dependencies between different tools and tasks, and automate the execution of jobs in the correct order. For our example self-hosted stack, we are using another great open-source tool called Dagster.

Dagster will perform the following key steps in our example crypto data pipeline:
Trigger Airbyte jobs: Dagster initiates the Airbyte synchronization tasks to extract the latest daily kline data from the Binance API. This data is then landed by Airbyte into our MinIO data lake.
Trigger Spark jobs: Once Dagster confirms the successful completion of the Airbyte extraction, it triggers our Spark job. This job reads the newly landed raw Parquet files from MinIO and loads them incrementally into our Apache Iceberg tables within the data lakehouse.
Orchestrate and execute the different dbt models: After the Spark job successfully updates the Iceberg tables, Dagster proceeds to orchestrate and execute our dbt models. This step transforms the data through our defined Data Vault and into the analytics-ready Data Mart tables.
With the help of Dagster, these jobs are executed reliably, in the correct order, and can be scheduled to start at a specified time. In our case, the entire pipeline – from extraction to the final dbt transformations – runs every night at 1 a.m., ensuring that fresh data is processed and available for analysis each morning.
In Dagster, all of the different tasks, data sources, tables, and even BI dashboards can be defined as assets. This asset-centric approach is powerful because it gives us deep insights into our data platform directly within the Dagster UI. We can easily visualize:
The dependencies and lineage between all assets (e.g., how a specific dbt model depends on an Iceberg table, which in turn is produced by a Spark job that consumes data landed by an Airbyte sync).
Historical runtimes, execution logs, and success/failure statuses for each asset's materialization.
Even test results from dbt, directly associated with the assets they validate, giving us immediate feedback on our data quality checks.
The lineage for our example crypto data pipeline, demonstrating the flow from source to transformed models as visualized in Dagster, looks like this:

Semantic Layer - Adding Business Meaning
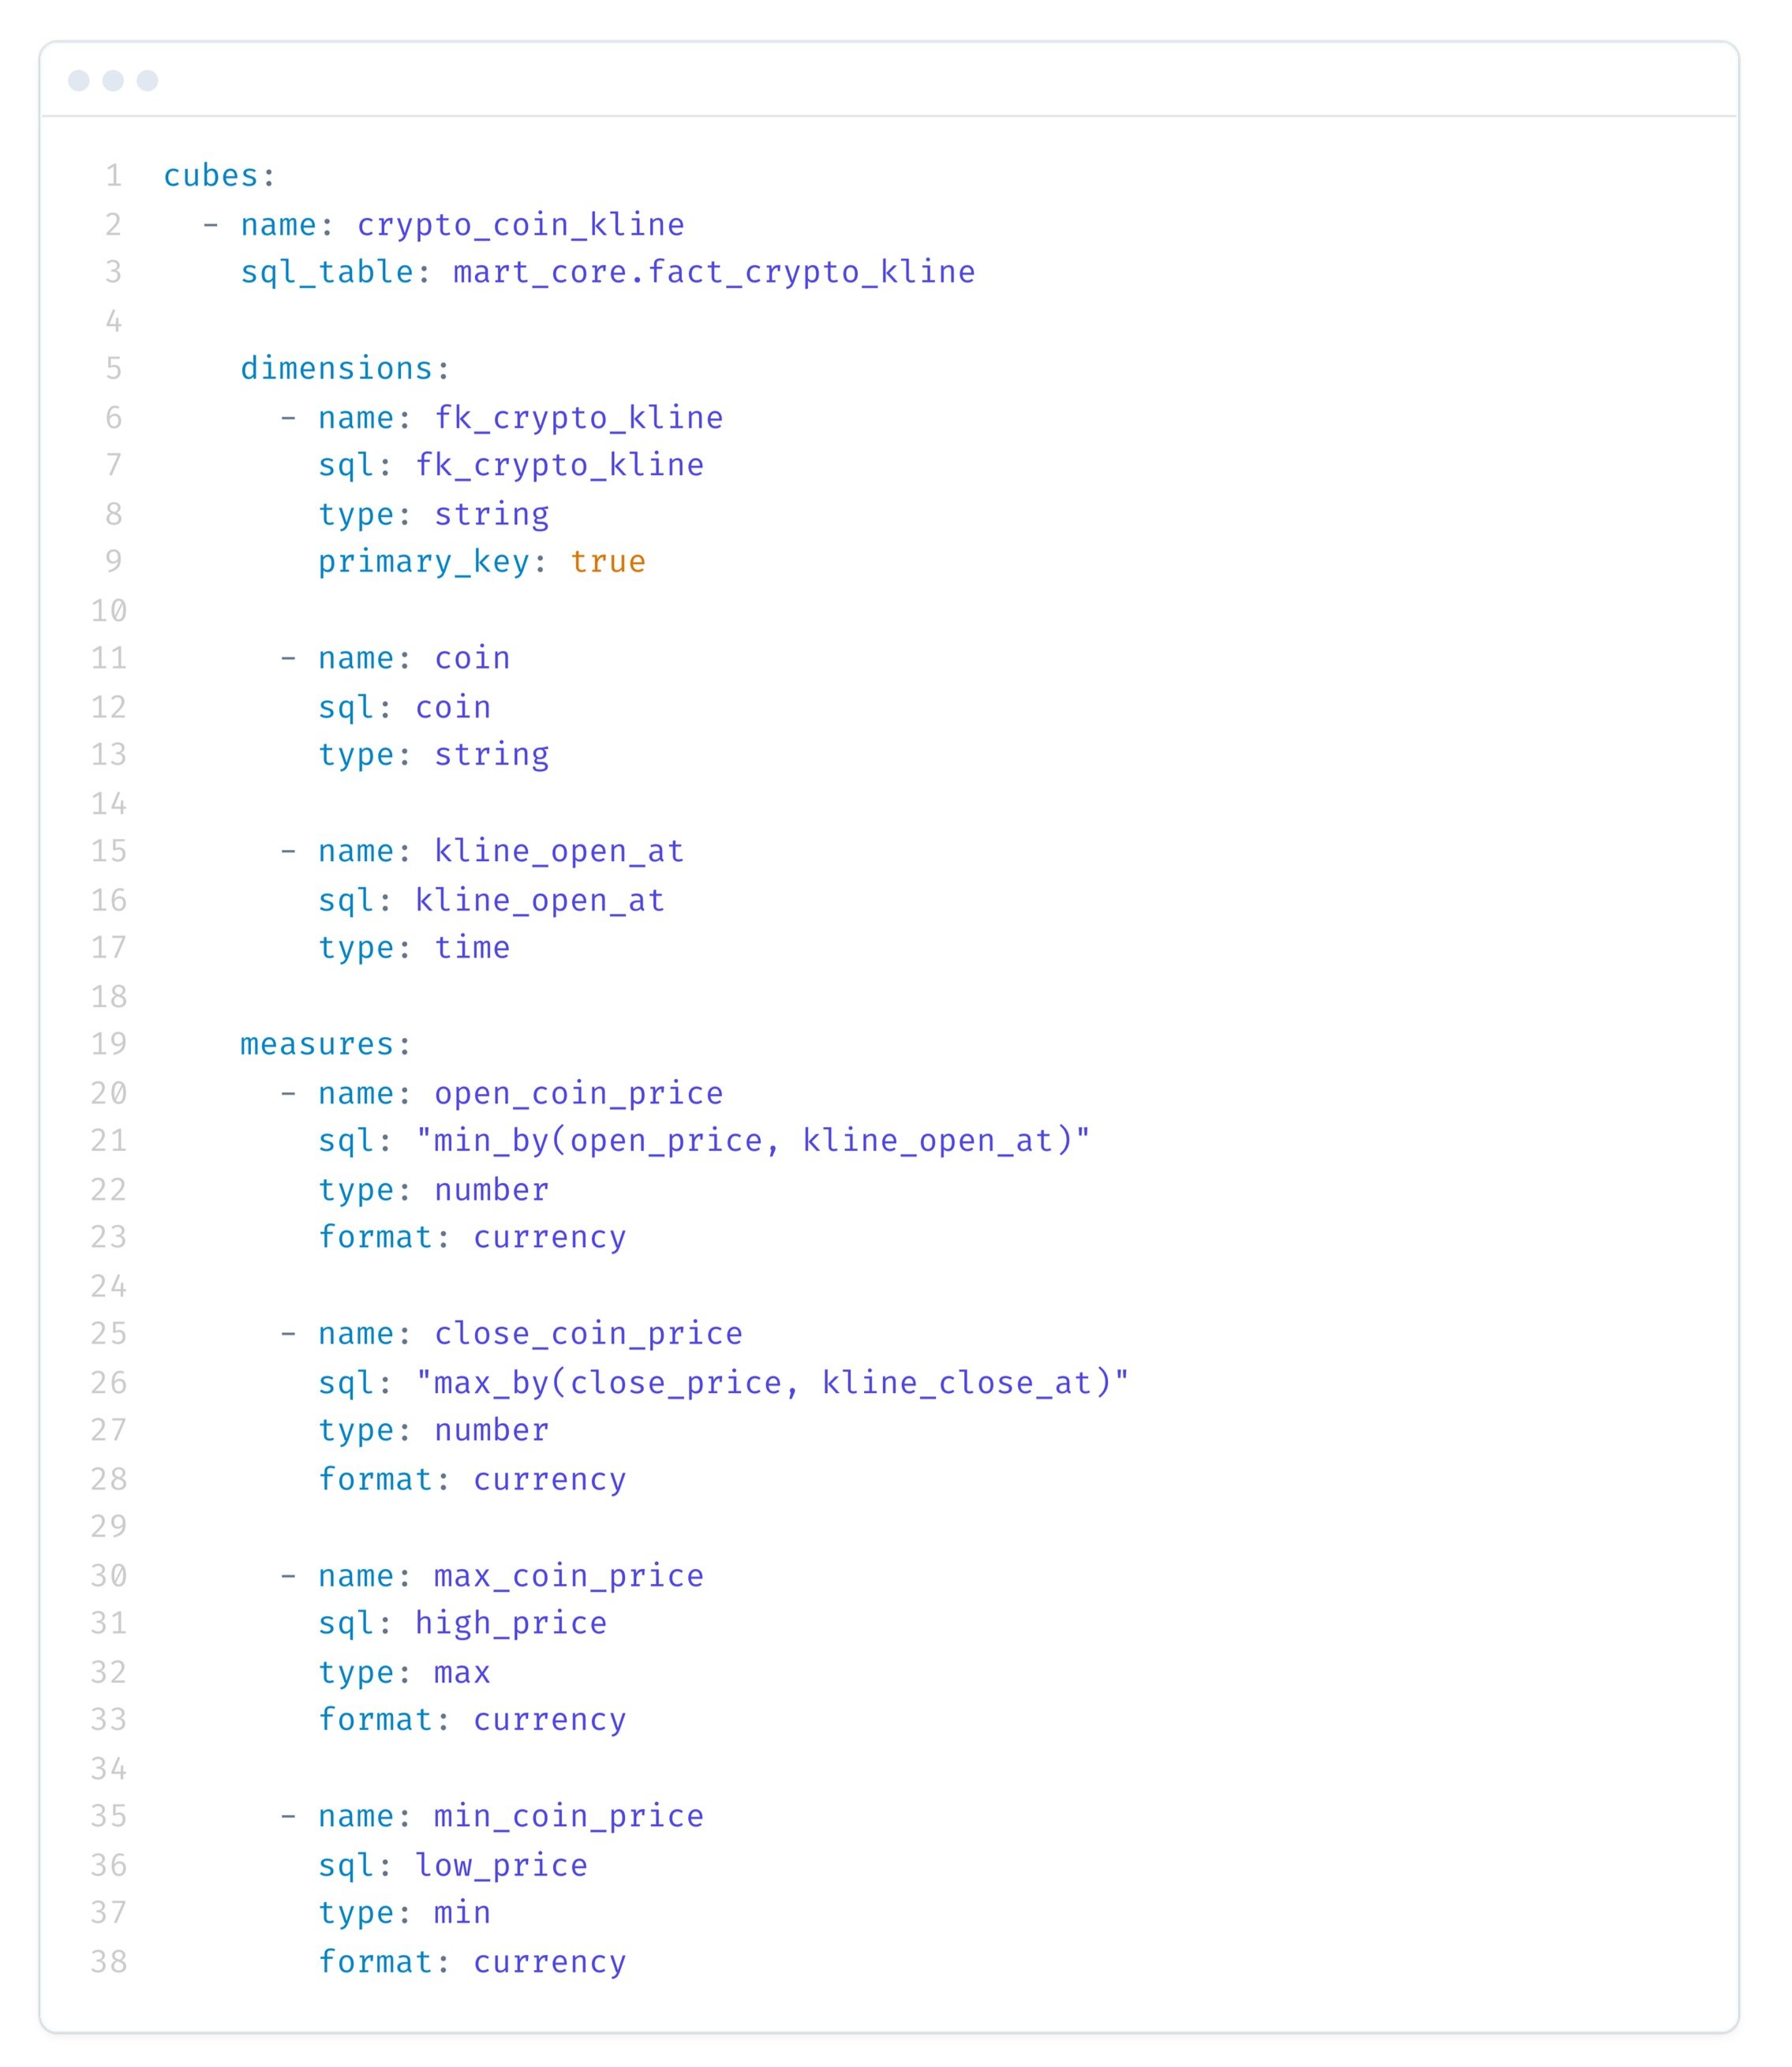
Here’s an illustrative example of how our crypto_coin_kline cube might be defined, pointing to our fact_crypto_kline table in the Data Mart:
After the previous steps, we now have clean data in a structured and optimized format available in our Data Mart tables within the lakehouse. So, practically, we are ready to start with our analytics. But before we directly connect visualization tools or other applications, we are going to add another crucial layer: the semantic layer.
The semantic layer is a logical layer that sits between our data consumers (like Business Intelligence tools or data applications) and the physical data stored in our data lakehouse. Its primary purpose is to simplify the interaction with our data. Within the semantic layer, we can centrally define business metrics (e.g., "total volume traded," "average closing price") and dimensions (e.g., "cryptocurrency," "date," "time interval"). This allows users and applications to access these pre-defined, governed measures and attributes without needing to write complex SQL queries themselves or even know the intricate details of the underlying table structures. In larger projects, this approach is vital for maintaining consistency in reported metrics across the organization, since everyone relies on a common, validated definition originating from the semantic layer.
The technology we are using to implement this for our self-hosted stack is Cube (formerly Cube.js). With Cube, you can define your data model (or "data graph") using a schema, manage access control, configure caching strategies for improved performance, and, importantly, expose your data to virtually every application via its versatile REST, GraphQL, and SQL APIs.
For our cryptocurrency kline example, we will define the following key measures:
open_coin_price: The opening price of the cryptocurrency for a given candle.close_coin_price: The closing price of the cryptocurrency for a given candle.max_coin_price: The maximum (high) price of the cryptocurrency during that candle's period.min_coin_price: The minimum (low) price of the cryptocurrency during that candle's period.
In Cube, these semantic definitions—including dimensions, measures, and relationships between different data entities—are typically declared in straightforward YAML files.
After we have defined these measures and dimensions within our Cube schema, and Cube is deployed and connected to our data lakehouse (via Trino), we are able to access these semantically rich objects via the different APIs Cube provides. When a query is made to a Cube API, Cube intelligently translates this request into an optimized SQL query that is then executed against our data lakehouse.
One of the powerful APIs Cube provides is its SQL API.
This allows applications and BI tools to connect to Cube as if it were a standard PostgreSQL database. This is particularly useful as many existing tools can leverage their native Postgres connectors.
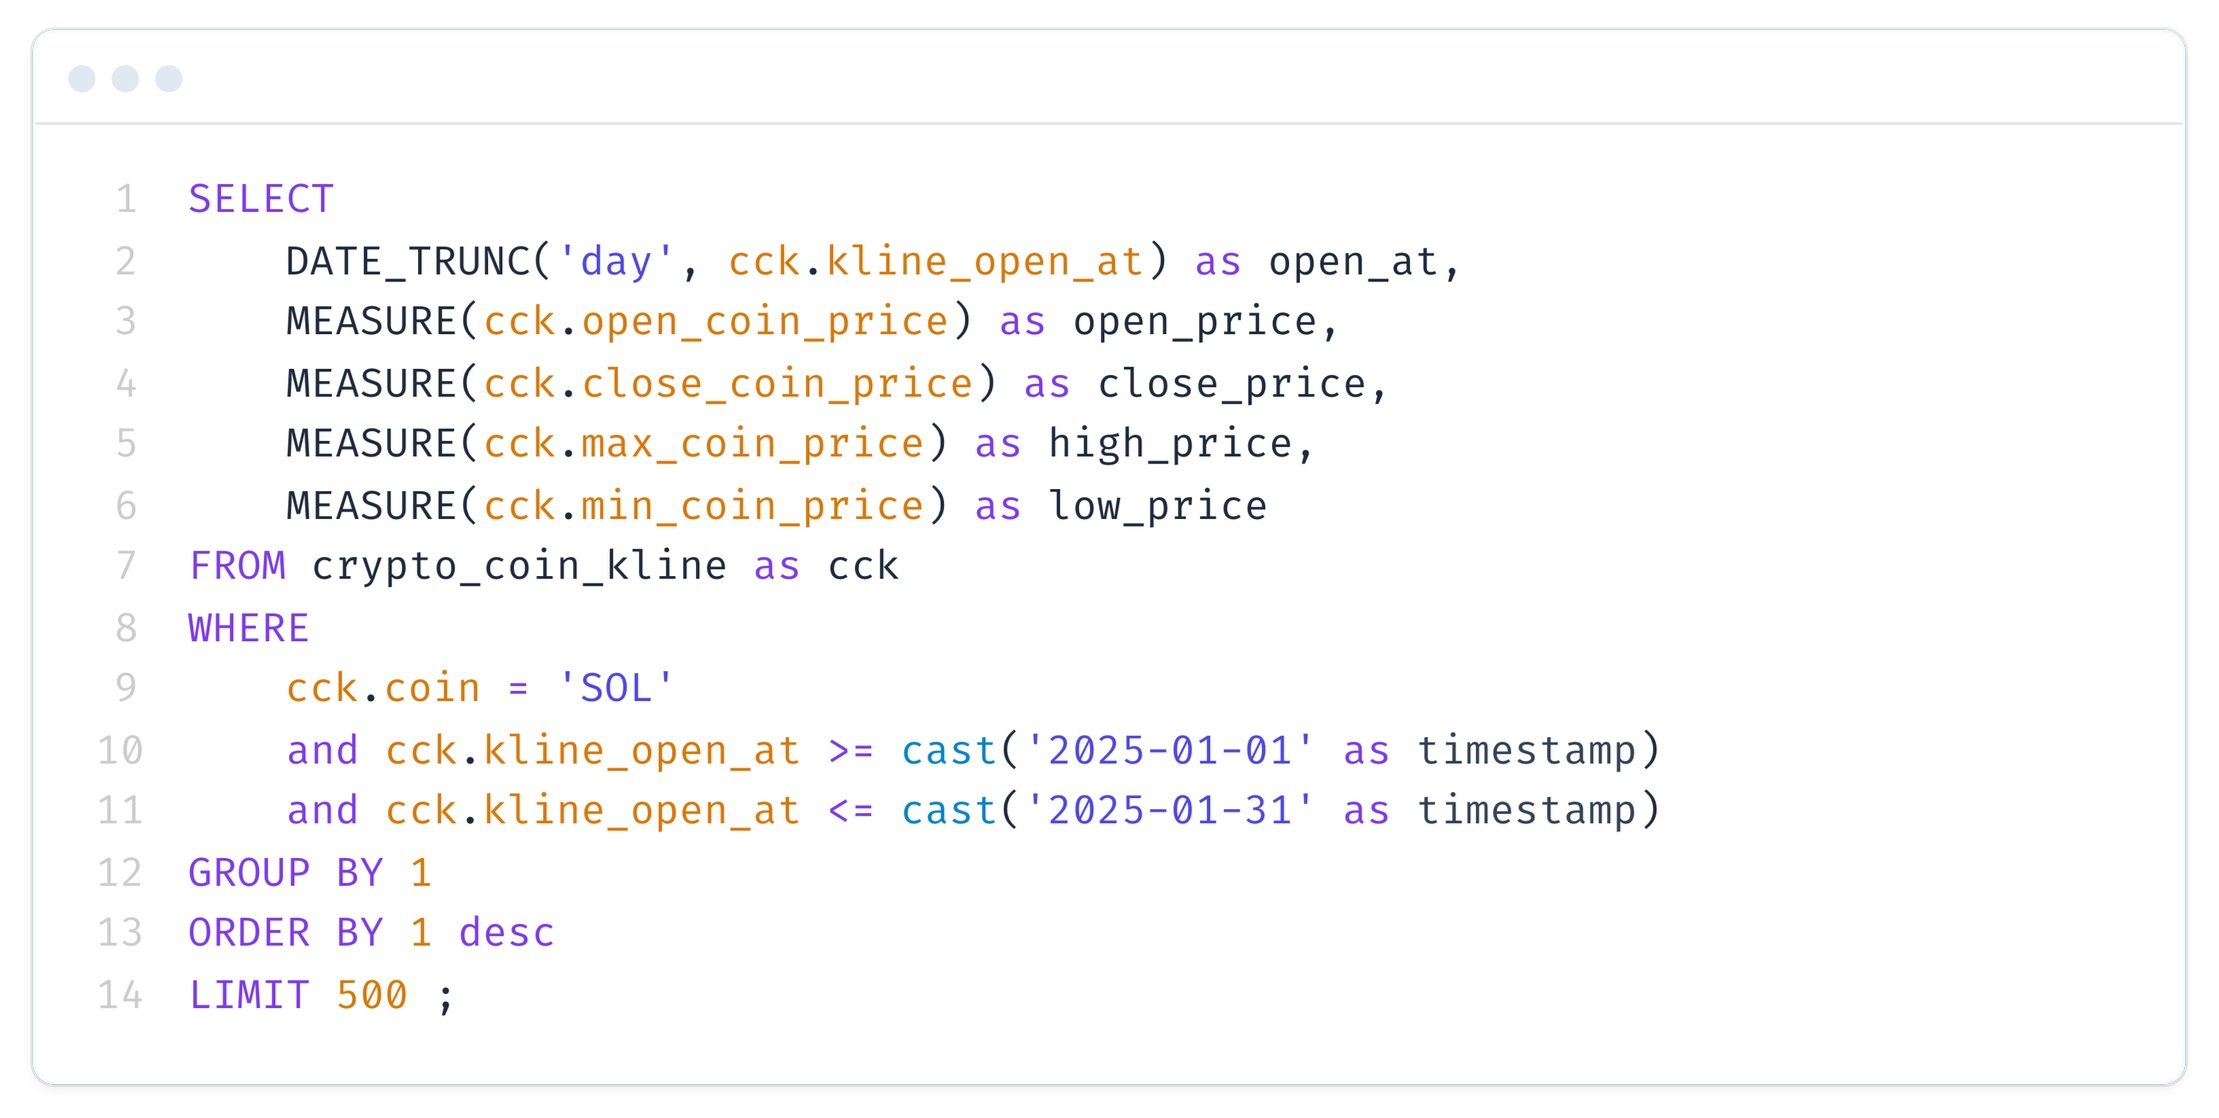
Here is an example of how we can utilize Cube's SQL API to query our defined measures for the 'SOL' cryptocurrency, aggregated by day for a specific date range:
Notice the special MEASURE() syntax used in the SELECT statement. This is specific to Cube's SQL API and allows us to directly reference the pre-defined metrics from our semantic model. This abstraction greatly simplifies query construction for end-users and ensures that everyone in the organization is using the same definitions and calculations for key business figures.
Analytics - Visualizing and Exploring with Streamlit
Now it is time to finally visualize the data we've meticulously processed and structured. This is where the value of our efforts becomes tangible, allowing us to see patterns, trends, and insights from our cryptocurrency kline data. To do this, there are multiple excellent open-source tools available that you can self-host. If you want to have a platform that allows you to build dashboards very easily using a drag-and-drop interface, Metabase might be the right choice for you, as it can readily connect to various data sources including the SQL API provided by Cube.
For our use case, however, we are using a code-based tool called Streamlit. Streamlit is an open-source Python library that enables you to create and share beautiful, custom web apps for machine learning and data science projects with remarkable ease.
With Streamlit, we are connecting to the semantic layer API provided by Cube (for instance, its SQL API, as demonstrated in the previous chapter). We then fetch the required data and use Streamlit's versatile functions and components to visualize it. All of this logic is contained within a simple Python file. The resulting dashboard application is then containerized using Docker and hosted on my server.
You can find the code for the Streamlit application, showing how it queries Cube and renders the candlestick charts, in this GitHub repository: https://github.com/svengonschorek/streamlit-homeserver/tree/master
Finally, we have what we set out to achieve: a dashboard that shows us the crypto candlestick chart, allowing us to visualize the crypto prices for a list of coins, all powered by our end-to-end self-hosted data stack.
Here you can see the actual dashboard that is running on my server (live as of May 2025): https://klines.bi-solutions-hamburg.com/